Wind cannibalisation and the CfD top-up wedge
cannibalisation
CfD
wind
capture-price
GB
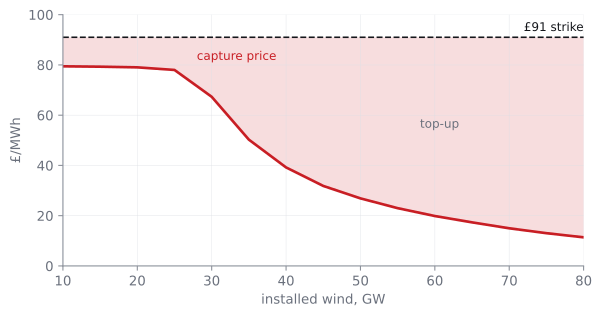
Hold the 2024 grid fixed and vary only wind: the price wind earns falls off a cliff, and the fixed CfD guarantee widens to fill the gap. The subsidy is structural, not transient.
INVESTIGATION · GB-TIER REPRODUCTION
Research question
A Contract for Difference pays a wind generator the gap between a fixed strike price and the market price it actually earns. As the fleet grows, wind floods its own generating hours and the price it earns — its capture price — falls. Does the subsidy therefore widen as we build more wind, rather than tapering as the technology “matures”?
Concretely: hold the 2024 GB system fixed and vary only installed wind. What does each unit of wind earn, and how large is the CfD top-up against a fixed £91 strike (the AR7 2024-money clearing price)?
Method
Run scenarios/gb-2024-reference.toml — real half-hourly 2024 demand and ERA5 weather — dispatched on merit order and priced at the system marginal cost (the SRMC of the last plant needed each half-hour). Sweep installed wind from 10 to 80 GW, onshore and offshore scaled proportionally from the 2024 split; everything else is held at 2024 (demand, solar, the thermal fleet, and the exogenous must-take traces). This deliberately isolates the cannibalisation channel.
Two derived quantities build the figure:
- capture price (£/MWh) =
wind_capture_ratio×mean_smp_gbp_per_mwh - CfD top-up wedge (£/MWh) = £91 strike − capture price
Result
Capture price is flat (~£78) up to ~25 GW, then falls off a cliff — the point where wind plus must-take first over-tops demand and gas stops setting the price in the windy, low-demand half-hours. The top-up widens as the fleet grows, against a strike that never moves.
| wind GW | mean SMP | capture ratio (value factor) | capture price | top-up vs £91 | curtailment |
|---|---|---|---|---|---|
| 25 | £78.7 | 0.991 | £78.0 | £13 | 0 |
| 30 | £73.0 | 0.923 | £67.3 | £24 | ~0 |
| 60 | £37.1 | 0.535 | £19.9 | £71 | 21.8 TWh |
| 80 | £26.6 | 0.428 | £11.4 | £80 | 58.6 TWh (24% of renewable potential) |
Reproduce it
Committed scenario, one command:
grid-cli sweep wind-capacity \
  --scenario scenarios/gb-2024-reference.toml \
  --out runs/cannibalisation --min-gw 10 --max-gw 80 --step-gw 5
The run writes module1_gas_marginal_vs_wind.csv with a header carrying the determinism triple (engine git hash · scenario SHA-256 · created-UTC) and a per-file SHA-256 for each data-pack file consumed. The pinned expected output lives at investigations/cfd-wind-cannibalisation/expected/ in the engine repo, and CI re-proves it on every push — the living green tick you can watch.
Regenerate the figure
The figure is drawn from two columns of the committed CSV. This is the rerunnable recipe that redraws it rather than hand-placing points:
# Redraw the capture-price wedge from the committed sweep output.
import csv, matplotlib.pyplot as plt

STRIKE = 91.0  # AR7 weighted-average, 2024 money
rows = [r for r in csv.DictReader(
    l for l in open("investigations/cfd-wind-cannibalisation/"
                    "expected/module1_gas_marginal_vs_wind.csv")
    if not l.startswith("#"))]
gw  = [float(r["wind_capacity_gw"]) for r in rows]
cap = [float(r["mean_smp_gbp_per_mwh"]) * float(r["wind_capture_ratio"]) for r in rows]

fig, ax = plt.subplots(figsize=(5, 3.2))
ax.axhline(STRIKE, ls="--", color="black", label="£91 strike")
ax.plot(gw, cap, label="capture price")
ax.fill_between(gw, cap, STRIKE, alpha=0.15)          # the top-up wedge
ax.set_xlabel("installed wind, GW"); ax.set_ylabel("£/MWh")
ax.set_ylim(0, 100); ax.legend()
fig.savefig("cfd-wedge.svg", bbox_inches="tight")
Note
The cell is not executed at build time on this scaffold, so quarto render has no Python dependency. At launch, investigation posts run under freeze: auto against their pinned engine tag and committed CSV.
Discussion — the honest bracket
The 2024-frozen copper-plate run is a bracket, not a bound. Two effects pull opposite ways, and the truth sits inside:
- Frozen flexibility overstates the collapse. A real 80 GW-wind system co-evolves storage, interconnection and flexible/electrified demand that absorb surplus and raise capture price. The modelled value factor falls to 0.43 at 80 GW; strongly interconnected high-wind systems (Denmark) sustain ~0.7–0.85. Much of that gap is the frozen-interconnection assumption.
- Single-node treatment understates it. Copper-plate GB ignores the B4/B6 boundaries, so it cannot see Scottish wind stranded behind full transmission — a locational cannibalisation that drives real constraint payments. The zonal sweep is the pessimistic bracket from the transmission side.
- The £0 price floor. The model floors SMP at £0 and cannot form negative prices, so the wedge implicitly pays a full
strike − 0top-up in surplus hours. This cuts subtly: older (AR1–3) contracts are still paid through short negative spells, so their real cannibalisation is worse than shown; but new (AR4+) contracts are paid nothing in a negative half-hour, so for them the wedge over-states the cash subsidy. See Limitations.
The robust result is the direction and the structure, not the last pound.
Conclusion
On today’s grid, each unit of new wind earns less the more wind we build, and the fixed CfD guarantee widens to fill the gap — from ~£13 at 25 GW to ~£80 at 80 GW against a strike that never moves. There is no fleet size at which the widening reverses under a frozen grid; flexibility softens it but does not turn a fixed guarantee back into the temporary leg-up it was sold as. The subsidy is structural.
Grid configuration
The exact grid this run describes — generated from the scenario by grid-cli describe, so it can never drift from the numbers above:
GB 2024 reference fleet (grid-cli describe)
Scenario: GB-2024-reference (schema v8)
Intent: Actual GB fleet, calendar year 2024, for Stage 1/2 validation against the 2024 data pack
Weather: 2024 (17568 half-hourly periods, 1 weather year).

Generation (9 technologies, 92.1 GW installed):
  ccgt            30.0 GW      offshore_wind   14.7 GW
  ocgt             1.0 GW      onshore_wind    14.4 GW
  nuclear          5.9 GW      solar           18.7 GW
  biomass          3.5 GW      coal             2.0 GW
  hydro            1.9 GW
Storage: pumped_hydro 2.8 GW / 24 GWh; battery 4.7 GW / 7 GWh
Interconnectors: 10 links, 9.3 GW total (FR, NL, BE, NO, DK, SEM)
Dispatch policy: rule_based
Note the sweep scales only wind; everything else — including these interconnectors — is held at its 2024 value.
Provenance
- Engine
-
grid-sim
f2e2c17· github.com/grid-modeller/grid-sim - Scenario
-
scenarios/gb-2024-reference.toml· SHA-256c4dbdd44…cfb4eb - Investigation
-
investigations/cfd-wind-cannibalisation/ - Run digest
-
e69aae08…285c4f(15 points) - Data pack
-
data/packs/2024.sha256· Zenodo DOI: pending Phase-0 record
Observed generation and demand: Supported by National Energy SO Open Data. Contains BMRS data © Elexon Limited copyright and database right 2024. Generated using Copernicus Climate Change Service information 2024.