The wire we have, the wire we’re buying, and the wire money can’t buy
constraints
transmission
wind
curtailment
CP2030
B4
B6
GB
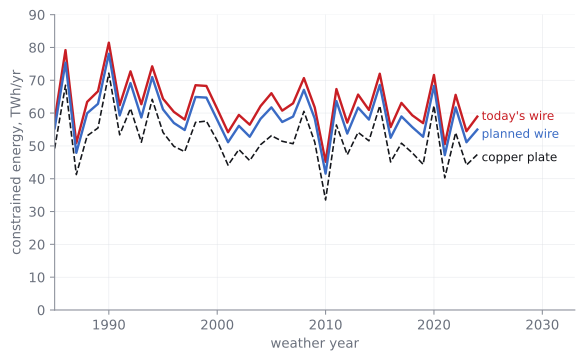
Take the Clean Power 2030 fleet and run it against forty years of real weather under three grids: today’s Scottish boundaries, the planned reinforcement, and a Britain with no internal wires at all. The upgrade does its job — the boundaries essentially stop binding — but it recovers only a third of the constrained energy. The rest is surplus no wire can move.
INVESTIGATION · GB-TIER REPRODUCTION
Britain’s wind is being built at one end of the country and used at the other, and the wires between are full. The bill for that — paying Scottish wind farms to switch off while English gas switches on — is the fastest-growing line item on the grid. The official answer is reinforcement: new pylons and undersea cables that roughly double what the Scotland–England border can carry by 2030.
This investigation asks a blunt question: how much of the problem does that wire actually solve? Take the Clean Power 2030 fleet, run it against every weather year since 1985, and do it three times — once on today’s wire, once on the planned wire, and once on a fictional Britain with no internal bottlenecks at all: the most any wire money could ever buy.
Research question
- How much renewable energy gets constrained off under the Clean Power 2030 fleet, and how much does it swing with the weather?
- How much of that does the planned boundary reinforcement (ETYS 2030: B4 to 7.3 GW, B6 to 15.4 GW) recover?
- How much would remain even with no network limits at all — the copper- plate limit that no transmission spend can beat?
Method
The Clean Power 2030 fleet (DESNZ capacity-range midpoints / NESO Further Flex and Renewables pathway) is placed on the three-zone GB model — north Scotland, south Scotland, everything else, joined by the B4 and B6 boundaries — using the wind pipeline’s registered locations, and run against all 40 weather years (1985–2024): 120 simulations of 17,568 half-hours each. The copper-plate variant is the identical fleet in a single zone, the strict same-everything comparator. Demand and interconnector behaviour follow the committed 2024 patterns, tiled across years and stated as conventions. Volumes only — this study prices nothing.
Every number below is a pinned regression value in the engine’s acceptance suite, and the pre-registered ordering — copper plate ≤ planned wire ≤ today’s wire, every single year — held in all 40 years.
Result
Annual constrained (curtailed) renewable energy, TWh, across 40 weather years:
| Min (2010) | Median | Max (1990) | |
|---|---|---|---|
| Today’s wire | 45.2 | 62.3 | 81.5 |
| Planned wire (ETYS 2030) | 41.6 | 58.5 | 78.1 |
| Copper plate (the limit) | 33.5 | 51.3 | 72.2 |
Three findings.
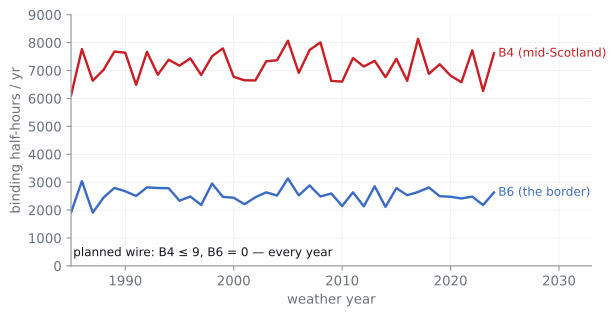
The planned wire does its wire job — completely. Under today’s boundaries, B4 (mid-Scotland) is full for 6,100–8,100 half-hours a year — a third of the year, every year for forty years — and B6 (the border) for 1,900–3,100. Under the ETYS-2030 capabilities, both boundaries essentially never bind again: B4 at most 9 half-hours in the worst year, B6 zero in all forty. Whatever constraint problem survives the upgrade, it is not a transmission problem.
And yet it recovers only a third of the constrained energy. The gap between today’s wire and the copper-plate floor is ~11.0 TWh a year at the median. The planned reinforcement recovers 3.8 TWh of it. The remaining 7.2 TWh — plus the 51.3 TWh that even copper plate curtails — is surplus: hours when wind and solar together simply exceed what demand, storage, and the (2024-frozen) interconnectors can absorb, no matter how it is moved around the country. The constraint headline is mostly an absorption problem wearing a transmission costume.
The weather is worth more than the wire. The swing between a calm year (2010) and a wild one (1990) is ~36 TWh on every variant — nearly ten times what the reinforcement recovers. Any single-year constraint forecast sits somewhere on a ±16 TWh weather lottery, which is why this study reports 40 years and not one.
Reproduce it
Every number is a pinned regression value:
cargo test -p grid-adequacy --release --test acceptance_cp2030_constraintThat runs all four acceptance tests: determinism, the 40-year ordering property, and the pinned annual constrained-energy and binding-hours series (investigations/cp2030-constraint-40y/expected/*.csv).
Discussion — what this does and doesn’t say
- Absolute levels are deliberately pessimistic; quote the differences. Three stated conventions inflate the TWh levels: interconnector flows are frozen at their observed 2024 pattern (the export relief valve doesn’t grow with the fleet), dispatch has zero foresight, and 2030 demand keeps 2024’s shape (no heat-pump or EV reshaping). All three apply identically to all three wires, so the differences between variants are far more robust than any level. An autarkic sensitivity run to bracket the interconnector convention is named future work.
- The fleet placement is a stated convention, not a claim. Wind follows the pipeline’s registered locations (NESO Scotland/rest split; the committed register-derived north/south sub-split); everything else keeps its 2024 geography scaled. The B4 binding intensity is sensitive to that offshore placement.
- Boundary counts are raw facts, not attribution. The model’s single-pass dispatch does not support a clean “B4 effect vs B6 effect” decomposition — binding counts are reported as measured, under the stated conventions.
- Two boundaries are not a network. B4/B6 are transfer-limit approximations; English internal boundaries are not modelled, so the copper-plate floor slightly overstates what unlimited transmission could achieve — which makes the “wire recovers only a third” finding conservative, not generous.
- The pumped-hydro fleet is 2024’s — no LDES build-out is modelled; stated, and it biases constrained energy up on every variant.
- No £. Constraint payments involve bid-offer economics this study deliberately excludes. Volumes only.
Conclusion
Run the 2030 plan against forty years of real weather and the constraint problem splits cleanly in two. About a third of the recoverable constrained energy is a genuine wire problem — and the planned reinforcement fixes it, so completely that the Scottish boundaries essentially never bind again. The other two-thirds, some 51–58 TWh a year at the median, is surplus that no conceivable transmission spend can place: it needs storage, demand, export, or it needs to not be built. The wire we’re buying is worth having. It is just not the answer to most of the number it gets blamed for.
Grid configuration
The three grids, from grid-cli describe — committed in full at investigations/cp2030-constraint-40y/grid-config.txt:
Clean Power 2030 fleet, three wires (grid-cli describe, abridged)
Fleet (all variants): CP2030 endpoint — 164.9 GW installed
  NSCO: offshore 10.9, onshore 8.4, hydro 1.6, ccgt 1.3, solar 0.9 GW
  SSCO: onshore 12.1, nuclear 0.7, solar 0.4 GW
  RGB:  solar 44.8, offshore 35.5, ccgt 33.7, onshore 7.5, biomass 4.0, nuclear 2.8 GW
  Storage: pumped_hydro 2.8 GW (2024 fleet carried, stated), battery 25.1 GW
Demand: 287 TWh (NESO consumer-demand boundary, stated), 2024 shape tiled x40 years
Weather: 1985–2024, all 40 years (701,280 half-hourly periods per variant)
Wires: 2024wire — tiled observed 2024 B4/B6 day-ahead limits
       plannedwire — ETYS 2025 HT 2030: B4 7,313 MW / B6 15,354 MW flat
       copperplate — single zone, no internal links (D13 comparator discipline)
Interconnectors: observed 2024 net-import traces, tiled (stated convention)
Dispatch policy: rule_based (zero foresight)
Provenance
- Engine
-
grid-sim
338c762· github.com/grid-modeller/grid-sim - Scenarios
-
scenarios/cp2030-3zone-2024wire.toml·cp2030-3zone-plannedwire.toml·cp2030-gb-copperplate.toml - Pinned tests
-
acceptance_cp2030_constraint.rs(determinism, 40/40 ordering,annual_series_pinned,binding_hours_pinned) - Investigation
-
investigations/cp2030-constraint-40y/(+ run report, data report, ten named conventions) - Data pack
- CP2030 pack · ETYS boundary capabilities · Zenodo DOI: pending Phase-0 record
Generated using Copernicus Climate Change Service information (ERA5 weather). Fleet: DESNZ/NESO Clean Power 2030 Action Plan (attributed; see the data report’s licence notes). Boundary capabilities: NGET Electricity Ten Year Statement 2025. Supported by National Energy SO Open Data.