The 38 gigawatts nobody has named
CCC
hydrogen
gas
dispatchable
GB
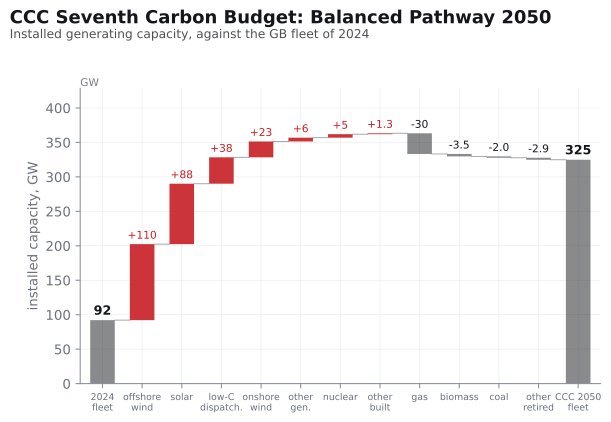
The Climate Change Committee’s 2050 system leans on 38.28 GW of plant it calls only “low-carbon dispatchable”, and does not say what it burns. Run it against forty years of weather and it is at full output in every single half-hour the system falls short. Serving those hours takes 161 GW — and 93 GW even after the pathway is handed every advantage it could ask for.
INVESTIGATION · GB-TIER REPRODUCTION
A companion to Forty winters against the Committee’s 2050 grid, which measures whether that system meets demand across the weather record and finds that it does not, in any of the forty years. This one takes that verdict as given and asks the next question: how much plant would it actually take, and what would that plant have to burn?
The answers are 161 GW, and either 320 TWh of hydrogen a year or 350 to 390 TWh of natural gas. The Committee specifies 38.28 GW and does not say which fuel.
The fleet under test
The pathway’s answer to a windless fortnight is 38.28 GW of what the Committee calls low-carbon dispatchable: gas with carbon capture, or hydrogen, or some mixture. It does not say which, and records the question as unresolved. Alongside it the Committee publishes 5 to 9 TWh of hydrogen storage, the range existing precisely because the fuel is undecided. The electricity storage is separate and much smaller: 433 GWh of pumped hydro and 139 GWh of batteries.
Everything below gives that plant unlimited fuel. It has a capacity and nothing else — no fuel chain, no supply constraint, no cost, and it never breaks down. That is deliberate and it is generous, and it is why every figure here is a floor rather than an estimate.
Why it falls short
The obvious objection to any modelled shortfall is that the model dispatched badly — that a better operator, or a cleverer rule, would have got through. This chart is here to close that off.
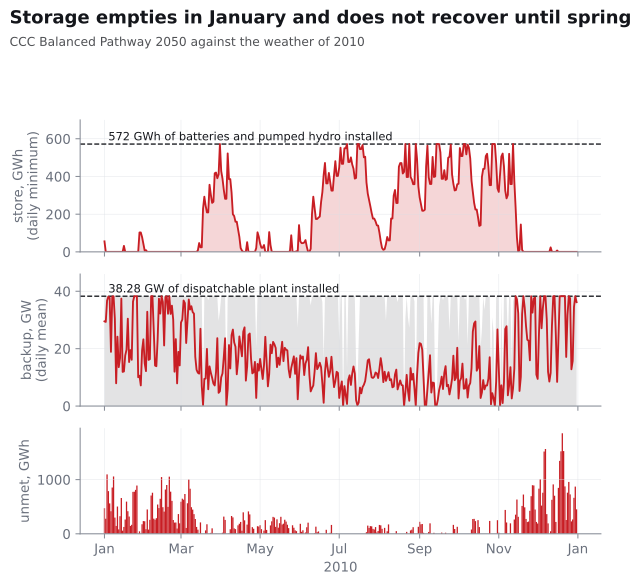
Three things are happening at once, and they are the whole mechanism. The batteries and pumped hydro empty in the first days of January and spend the rest of the winter on the floor. The dispatchable plant runs flat out through the same months. And demand still goes unmet, in quantity, for four months of the year.
Nothing was left unused. In 2010 the plant is at its full 38.28 GW in every one of the 2,110 hours the system falls short — not one of them is a case of idle capacity that could have been called. And that holds across the whole record, not just the worst year: of the 103,107 half-hours in which this system fails to meet demand, the plant is at maximum output in 103,107 of them.
So the failure is not a dispatch failure and cannot be fixed by better operation. There was nothing left to dispatch. It is a shortage of plant.
How much plant would be needed
Solved rather than subtracted — extra firm capacity changes the dispatch, because storage no longer drained to cover one deficit arrives at the next with charge it did not have — the answer is 161 GW, against the 38.28 GW published. A factor of four.
That is the most assumption-sensitive number this study produces, because it is set by the deepest half-hours. So before it is quoted it is handed every advantage the pathway could reasonably ask for, one at a time and then all together.
| granted | requirement | × published |
|---|---|---|
| nothing — as committed | 161 GW | 4.2 |
| perfect foresight | 147 GW | 3.8 |
| managed vehicle charging | 157 GW | 4.1 |
| the Committee’s own demand flexibility | 130 GW | 3.4 |
| full firm interconnection | 133 GW | 3.5 |
| all four at once | 93 GW | 2.4 |
Perfect foresight replaces the engine’s myopic storage rule with an operator who can see the whole weather record coming and hold charge back accordingly. It is worth 14 GW. The direction was never in doubt — an optimising operator can always reproduce whatever the simple rule would have done, so foresight can only lower the requirement — but the magnitude settles whether it matters, and 8.9% does not change what the figure means. It is also a genuine effect rather than solver noise: at 147 GW the myopic rule is still short by about 1,900 GWh.
Managed charging was the reason this figure was held back, and it turns out to be the weakest of the four at 4 GW. The committed scenario charges vehicles on plug-in, putting up to 90 GW of load on the evening peak, and an assumption that large sitting on the deepest half-hours is exactly the sort of thing that manufactures a result. But managed charging moves load within a day, and the requirement is set by the worst fortnight, not the worst evening. Flattening each day inside a two-week windless freeze leaves the fortnight’s total demand exactly where it was.
The Committee’s own demand flexibility is the largest single advantage, worth 31 GW. It is modelled as the published 32.55 GW shifting load within a 48-hour window — energy taken off a peak returned to the same window’s troughs, to the last megawatt-hour, never shed. That distinction matters, because the Committee publishes no split between flexibility that moves demand and flexibility that removes it, and modelling it as removal would flatter the pathway by relabelling its failures as savings.
Full firm interconnection is worth 28 GW and is the most generous assumption here. The committed scenarios model Britain as an island; this hands it all 27.9 GW of published capacity, firm, in every half-hour of forty years. No cable is ever out. The exporting market always has power to spare — though a cold, still European anticyclone is the same weather event on both sides of every cable, so the hours Britain most needs imports are the hours its neighbours do. And Britain’s own export obligations do not exist.
Grant all four together and the requirement is 93 GW: still two and a half times what the Committee specifies, and now a floor rather than an estimate, because there is nothing further to concede. The four are worth less together than apart — 77 GW of relief separately, 68 GW combined — because they are all competing to fill the same scarce half-hours.
What that plant is then doing
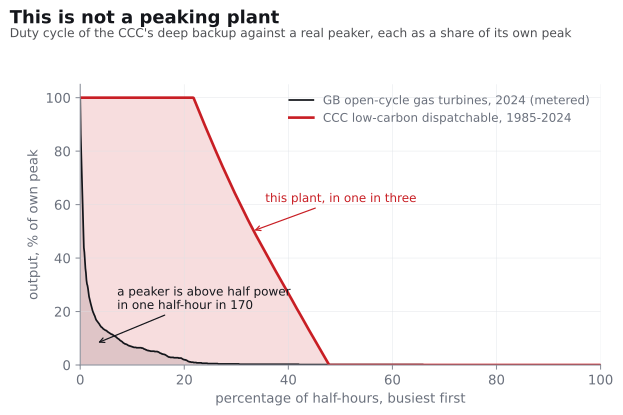
The Committee describes this plant as backup and costs it as though it ran 20% of the time, publishing it generating 47.65 TWh a year — a load factor of 14%. Run against the weather it delivers 114 TWh a year at 34%: two and a half times the duty, at three-fifths of the assumed price.
But the sharper reading is the other way round. The Committee’s 14% is not wrong — it is the right load factor for a fleet four times the size. The 161 GW fleet that actually serves the record runs at 13%, and every other adequate fleet in the table above lands between 12% and 14%. It is the Committee’s own duty-cycle assumption that implies the capacity we measure. Its plant grinds at 34% precisely because there is too little of it.
Which brings the fuel bill, and the question the Committee has not answered.
If it burns hydrogen
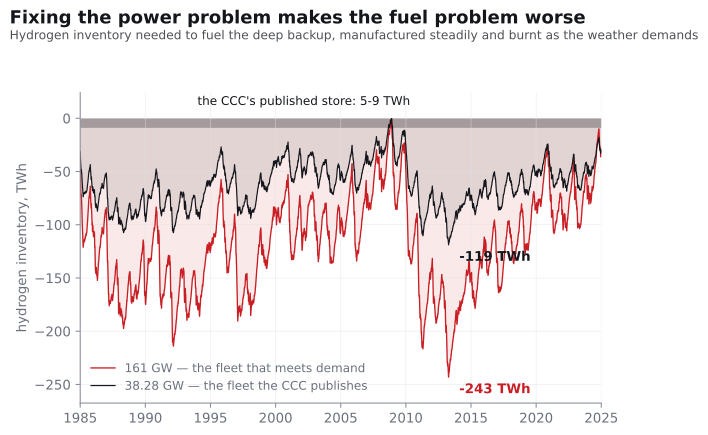
To fuel the Committee’s own 38.28 GW as the weather demands, hydrogen has to be manufactured at about 570 GWh a day, every day — 207 TWh a year — and the tank riding the record has to hold 119 TWh, thirteen to twenty-four times what the Committee publishes.
But that is the fleet that fails. The 161 GW that meets demand burns 320 TWh a year and needs a tank of 243 TWh: twenty-seven to forty-nine times the published store. Note the direction, because it is the opposite of reassuring — the bigger the fleet you build to keep the lights on, the more hours it runs and the more fuel it gets through, so the larger the tank behind it must be. Solving the power problem enlarges the fuel problem.
At TWh scale hydrogen means salt caverns; nothing else works at that size. A 243 TWh tank holds 7.3 million tonnes of working hydrogen. On the British Geological Survey’s assessment of UK cavern potential — which puts the average modelled cavern at about 164 GWh — that is on the order of fifteen hundred caverns. The same assessment finds that every existing natural gas storage cavern in the country, if converted, would hold 4.7 TWh of hydrogen, with a further 8.5 TWh in projects then in planning, and notes that both are likely still needed for natural gas.1
If it burns gas with capture
The tank question disappears: Britain has a gas system, terminals and pipelines already. What replaces it is a volume, and a disposal problem.
The 161 GW fleet needs 350 to 390 TWh of natural gas a year, in 2050 — between a third and two-fifths of the 995 TWh Britain’s gas transmission system delivered in 2024 — a figure from the same British Geological Survey assessment cited above — for electricity backup alone, in a system whose defining claim is that it has stopped burning gas. That produces 64 to 71 Mt of CO₂ a year, all of which must be captured, piped and buried. And at 90 to 95% capture, 3 to 7 Mt a year is still emitted, from this plant alone, in a net-zero system.
Two assumptions there are ours and are declared: the thermal efficiency of gas-with-capture, carried as a 45 to 50% band, and the capture rate as 90 to 95%. Both are generous: capture rates are quoted for steady operation, and a plant that starts and stops as often as this one would realise less. The emission factor is not ours and is not a band: 0.18253 tonnes of CO₂ per MWh of gas burnt, gross calorific value, from the UK Government’s 2024 greenhouse gas conversion factors.2
What none of it changes
The Committee’s 38.28 GW of unnamed dispatchable plant is not a little optimistic. Under the most generous set of assumptions this study can construct without abandoning arithmetic, it is short by a factor of two and a half, and on its own committed terms by a factor of four.
And whichever fuel it turns out to burn, the supply chain behind it is one Britain does not have and is not building: either a hydrogen store up to fifty times the size of the one the Committee publishes, or a continuing gas habit of 350 to 390 terawatt-hours a year with 64 to 71 megatonnes of carbon dioxide to bury annually.
The Committee has not said which. That is the finding.
Footnotes
J.D.O. Williams et al., “Does the United Kingdom have sufficient geological storage capacity to support a hydrogen economy? Estimating the salt cavern storage potential of bedded halite formations”, Journal of Energy Storage 53 (2022) 105109, CC BY 4.0. https://doi.org/10.1016/j.est.2022.105109. Total theoretical potential 2,151 TWh across 13,100 modelled caverns in three basins; the 164 GWh average is that total over that count.↩︎
UK Government GHG Conversion Factors for Company Reporting 2024, condensed set v1.1, “Fuels” sheet, natural gas per kWh (gross CV). OGL v3.0. https://www.gov.uk/government/publications/greenhouse-gas-reporting-conversion-factors-2024↩︎