Forty winters against the Committee’s 2050 grid
adequacy
CCC
heat-pumps
EVs
weather-years
GB
Put the Climate Change Committee’s own 2050 electricity system against every weather year since 1985, with cold driving demand rather than just wind driving supply, and it fails in all forty. It keeps failing in all forty after being handed the better turbines its own pathway implies, the whole of its own demand flexibility, and every interconnector as firm supply.
INVESTIGATION · GB-TIER REPRODUCTION
Every decarbonisation pathway is a bet on a grid nobody has run yet. The weather is the half we do have. Forty years of it sits on the record, half-hourly: the wind that blew, the sun that shone, and how cold it was while they did or did not.
The Climate Change Committee’s Seventh Carbon Budget sets out a 2050 electricity system in real detail, wind and solar and storage and firm plant, published by subsector and by year. What it does not do is put that system against the record. This does, and it changes one thing that turns out to matter more than all the rest: cold drives demand, not just wind driving supply.
What we would have to build
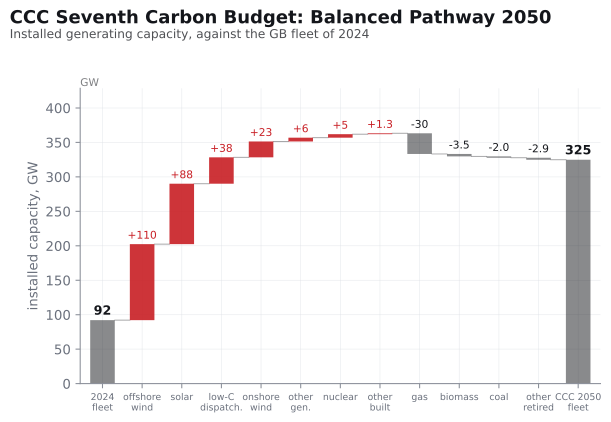
Britain’s generating fleet is 92 GW today. The Committee’s 2050 fleet is 325 GW. Getting from one to the other means building 271 GW and retiring 38, and 221 GW of that build is wind and solar.
| 2024 | CCC 2050 | ||
|---|---|---|---|
| Installed generating capacity | 92.1 GW | 324.9 GW | ×3.5 |
| of which wind and solar | 47.8 GW | 268.8 GW | ×5.6 |
| Firm plant | 44.3 GW | 56.0 GW | ×1.3 |
| Annual demand | 261.8 TWh | 692.0 TWh | ×2.6 |
| Storage energy | 31 GWh | 572 GWh | ×18.7 |
| Interconnection | 10.3 GW | 27.9 GW | ×2.7 |
Two rows carry the argument. Capacity triples. Firm plant, meaning generation that runs when asked rather than when the weather allows, rises by a third, 44.3 GW to 56.0. Demand more than doubles. A system serving 692 TWh behind 56 GW of firm plant is a system betting on the weather, and this investigation prices that bet.
The Committee publishes no system peak. Scale 2024’s demand shape up uniformly and you get about 126 GW, a figure that keeps 2024’s load factor by construction and so assumes electrified heat and electric cars leave the daily profile exactly where it is. They do not, and most of what follows is why.
Research question
Take the CCC’s Balanced Pathway 2050 generating fleet and storage fleet exactly as published. Run it continuously across 1985–2024 at half-hourly resolution, with each year’s real wind, real sun and real temperature. Then ask:
- In how many of the forty years does the system fail to meet demand?
- Is 2010 — the cold, still year that gets quoted — exceptional, or ordinary?
- What is the 2050 peak, and how much of it is an assumption rather than a measurement?
- Does the answer survive handing the pathway every advantage it could reasonably claim?
Method
Two scenario files, identical in fleet, storage, demand total and loss treatment. They differ in exactly one respect, so everything between them is attributable to that alone.
The control tiles the observed 2024 demand shape onto every weather year. Each year therefore feels its own wind and its own sun, but no year is felt as cold. This is adequacy-favourable by construction and it is the reading a model gets if it treats demand as a fixed profile.
The study run lifts the Committee’s own residential heat electricity out of that flat total and puts it back as a temperature-driven load, and does the same for road vehicles. The quantities are the Committee’s, transcribed from its published subsector data — 140.091 TWh of residential heat electricity and 165.608 TWh of road transport at 2050 — not estimated. What the model supplies is the shape: how that electricity is distributed across the half-hours of a year, given the temperature.
Both runs are generation-side. The Committee’s published 692.025 TWh is measured at the meter; grossed for network losses it becomes 767.831 TWh that the fleet must actually produce.
Interconnectors are switched off entirely, and storage state carries across year boundaries rather than resetting each January. Every number below is a pinned regression value in the engine’s acceptance suite.
Result
The system fails in every year of the record, in both runs. Modelling the cold does not change whether it fails; it changes the size of the failure by a factor of nearly four, and it changes which year is worst.
| shortfall across the record | 2010 | 2010’s rank | years short | |
|---|---|---|---|---|
| wind and sun only | 470.1 TWh | 18,815 GWh | 3rd of 40 | 40 / 40 |
| cold and vehicles modelled | 1,751.1 TWh | 79,434 GWh | 1st of 40 | 40 / 40 |
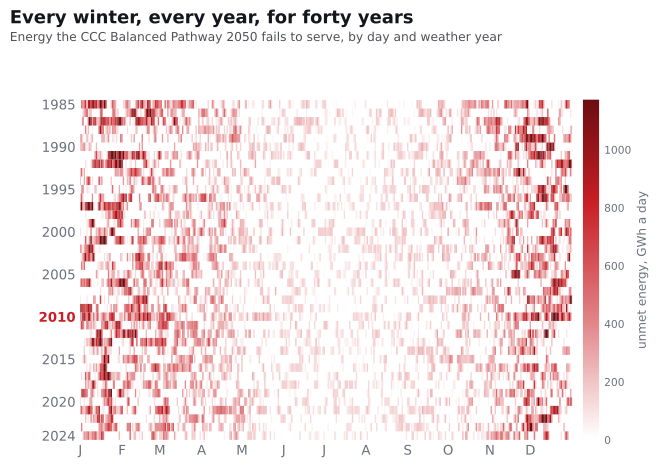
2010 is the worst of the forty once cold is modelled, but three other years land within a quarter of it and the median year still sheds 40,097 GWh. The system does not fail because one year was strange. It fails because it cannot cover a cold, still fortnight, and the record has no shortage of those.
The carpet also shows something the annual totals hide. The system does not run comfortably for eight months and then break: it is short on roughly two days in five even in July, though those days are shallow and account for a few per cent of the total. What winter changes is not whether the system falls short but by how much, and by then the shortfall is running at hundreds of gigawatt-hours a day for weeks at a time.
Why the cold does so much
Two things happen at once when the temperature falls, and they compound.
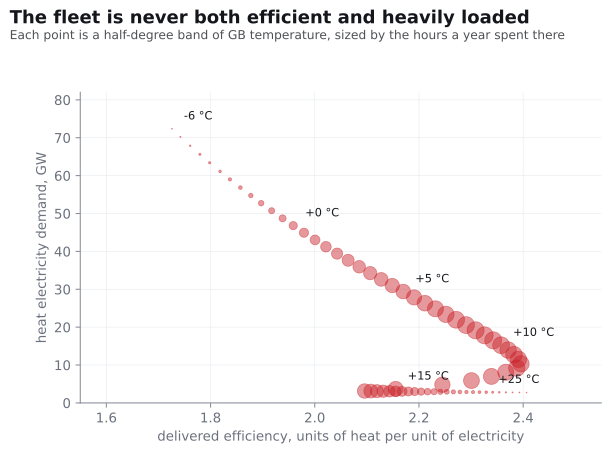
Heating demand rises as it gets colder, which surprises nobody. The half that gets missed is that the machine meeting that demand gets worse at the same time. A heat pump moves heat across a temperature gap, and the gap opens exactly as the load grows. Over the whole record the fleet delivers 2.18 units of heat per unit of electricity. In the coldest half-hours it delivers 1.63.
The two ends of that relationship, as pinned values:
| delivered efficiency | residential heat electricity | |
|---|---|---|
| whole-record average | 2.1831 | 155.44 TWh a year, generation-side |
| single coldest half-hour on record | 1.6253 | up to 87 GW at once |
That annual figure is not a modelling choice. The overlay is solved so its average annual draw reproduces the Committee’s own published 140.091 TWh at the meter, to four decimal places. The heat is ours; the electricity is theirs.
One winter in detail: 2010
Of the forty, 2010 is the worst, so it is the one worth opening up. Everything in this section is that single year; the sections either side of it are the whole record.
2010’s shortfall more than quadruples. Its hours short go from 1,005 to 2,110, its deepest half-hour from 58.1 GW to 142.6. It moves from third-worst year to worst. That was measured, not aimed at: the run was built and executed before anyone looked at the ranking.
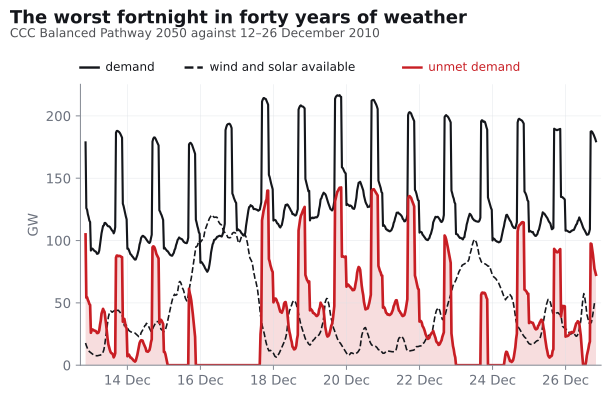
The shape matters more than the depth. This is not a run of evening peaks a battery fleet shaves off. It is a continuous week and a half with no wind, and storage that emptied on the second day and never recovered.
The peak, and the assumption inside it
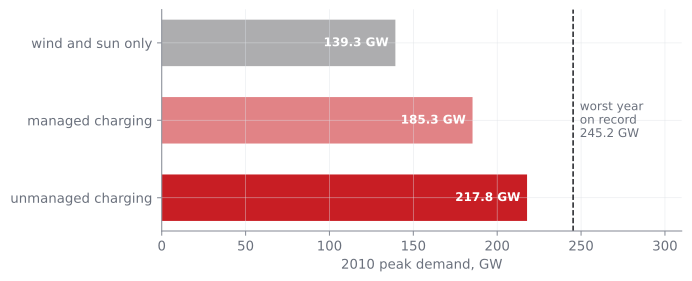
The 2050 peak has two defensible answers 32.5 GW apart, and the whole gap is a guess about what people do at six in the evening. Plug in when you get home and the car load stacks straight onto the existing peak. Charge overnight on a tariff and it drops into the trough. The Committee does not say which it assumes. Nor does anyone else.
| 2010 peak demand | GW |
|---|---|
| wind and sun only | 139.3 |
| cold and vehicles, managed overnight charging | 185.3 |
| cold and vehicles, unmanaged charging on arrival | 217.8 |
| worst year on record (1987), unmanaged | 245.3 |
A pathway that quietly assumes managed charging reports a peak in the 180s. The same pathway, same fleet, same weather, reports 218 if people carry on charging the way they do now. Both are honest numbers. Only one of them ever gets quoted.
What stands behind it, and what it would take
The plant the pathway relies on to cover a windless fortnight is 38.28 GW of what the Committee calls low-carbon dispatchable, with the fuel unresolved. What that plant is actually asked to do across the record, the hydrogen inventory it implies, and the size of fleet that would serve every half-hour are a study in themselves: The 38 gigawatts nobody has named.
One result from it belongs here, because it settles what kind of failure this is. Of the 103,107 half-hours in which this system fails to meet demand, the backup is at its full 38.28 GW in 103,107 of them. Every single one. The binding constraint is generating capacity, not stored energy, and no quantity of storage of any kind changes that.
The pathway granted every advantage
The strongest objection to a study like this is that the assumptions made the result. So the largest corrections available to the Committee were run as bookends: not built into the model, handed to it.
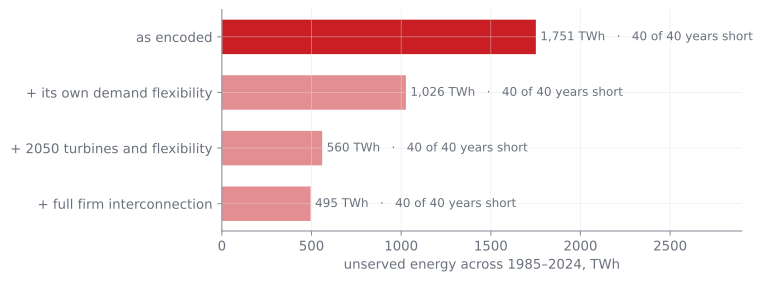
| shortfall across the record | 2010 | years short | |
|---|---|---|---|
| as encoded | 1,751 TWh | 79,434 GWh | 40 / 40 |
| + its own demand flexibility | 1,026 | — | 40 / 40 |
| + 2050 turbines and flexibility | 559 | 35,312 | 40 / 40 |
| + full firm interconnection | 495 | 27,106 | 40 / 40 |
Two findings sit inside that table.
Flexibility is the best card the pathway holds, and it is not enough. The Committee’s own 32.55 GW of demand flexibility takes out about 40% of the shortfall, far more than it managed before vehicles were modelled, because charging really is shiftable in a way heating is not. All forty years still fail with it played.
The autarky objection has been measured, and it does not hold. Switching the interconnectors off is the most attackable choice in this study, so the pathway was handed all 27.9 GW as firm supply in every half-hour of forty years: no outages, no export obligation, no correlated scarcity when the same anticyclone parks over both ends of the cable. That is not a forecast, it is a ceiling. Every weather year still falls short, and 2010 still sheds 27,106 GWh over 744 hours.
The finding that is not about the model
Calibrating the heat load turned up something in the Committee’s own figures that does not add up. It is here because it was found, not because anyone went looking for it.
The Committee’s energy-flow data puts the heat lifted from air and ground by every heat pump in the whole 2050 economy at 176.76 TWh. At the efficiency its own numbers imply, residential heating alone accounts for about 165.7 TWh, leaving roughly 11 TWh for all of industry, commerce and public buildings. The Committee separately publishes 53.83 TWh of industrial heat-pump output, which needs something like 36 TWh of ambient heat on any efficiency worth arguing about. Those two do not fit in the same envelope.
Three readings are available. Building-heat efficiency is lower than our curves give, which would mean more resistance heating and a worse peak than we model. Or the 176.76 TWh does not mean what it looks like it means. Or the published figures do not reconcile. Two of the three make the Committee’s system look worse than we make it.
This is a question, not an accusation. It is the sort of thing that usually has a dull explanation, and if there is one we would like to print it.
Reproduce it
Every number on this page is a pinned regression value:
cargo test -p grid-adequacy --release --test acceptance_montford_2010Ten tests, no #[ignore]. They fail loudly if the per-year data packs are missing, and they hold bit-for-bit while the two scenario files, the data packs and the engine are unchanged.
Discussion — what this does and doesn’t say
- It is not a forecast. It is a measurement of one published fleet against one weather record. A pathway is allowed to change; this says what the currently published one does.
- The charging assumption is unresolved and load-bearing. 32.5 GW of the 2050 peak turns on it. This study reports the bracket rather than picking an end, and that is the first question worth putting to any pathway author.
- Several omissions run in the Committee’s favour, and must travel with any quotation from this page: non-residential building heat is still weather-blind, because the Committee publishes no separate figure for it; heating carries no within-day occupancy profile, so daily peaks are lower bounds; and there is no plant outage model at all — every station is available unless a declared schedule says otherwise.
- Two omissions run against it. There is no vehicle-to-grid, so the fleet cannot support the system in a lull; and a passenger-car cold-derating curve is applied to heavy goods vehicles, which probably overstates their response.
- One national temperature series. Regional spread is invisible, which smooths the extremes slightly in the pathway’s favour.
- The years are not independent samples. Storage state carries across year boundaries, which is the honest construction for a storage question but means a bad year inherits what its predecessor left behind.
- Prior work. Andrew Montford published a comparable experiment on the single weather year 2010 shortly before this was finished, and reached a similar conclusion. This is an independent run over the full record.
Conclusion
The Committee’s 2050 electricity system does not survive the weather Britain actually has. It fails in all forty years on wind and sun alone, and by nearly four times as much once cold drives demand as well as wind driving supply. It goes on failing in all forty after being handed its own demand flexibility, the better turbines its own output implies, and every interconnector as firm supply.
The peak is 218 GW in 2010 and 245 GW in the worst year on record. The first of those drops to 185 GW on a different and equally defensible assumption about when people charge their cars. That 32.5 GW rests on a behavioural question no published pathway answers, and settling it would sharpen this argument more than another decimal place anywhere else.
Grid configuration
The grid behind the run (grid-cli describe)
Scenario: ccc-cb7-bp-2050-40y-heated (schema v9)
Weather: 1985-01-01 .. 2024-12-31, all 40 years (701,280 half-hourly periods)
Demand basis: CCC CB7 Balanced Pathway 2050, 692.025 TWh consumption-side,
  grossed to 767.8308 TWh generation-side for network losses (9.873%)
  of which residential heat electricity 140.091 TWh (155.4368 gen-side),
  reproduced by a temperature-driven overlay BY CALIBRATION
  and road transport 165.6079 TWh, transcribed by subsector
Interconnectors: 27.938 GW declared, modelled at ZERO availability (autarkic);
  the generous bookend runs them as firm in every half-hour
Storage: state carries across year boundaries (no annual reset)
Dispatch policy: rule_based
Control twin: ccc-cb7-bp-2050-40y (identical but for the temperature response)
Provenance
- Engine
-
grid-sim
26eb6a0· github.com/grid-modeller/grid-sim - Scenarios
-
scenarios/ccc-cb7-bp-2050-40y-heated.toml,scenarios/ccc-cb7-bp-2050-40y.toml - Pinned tests
-
acceptance_montford_2010.rs— ten tests, all values asserted - Data packs
-
cf-physical,demand-tiled,gb_t2m_pop - Source data
- CCC Seventh Carbon Budget full dataset (subsector-level); ERA5 reanalysis for temperature and capacity factors
- Cold-response curve
- Wu & Zhu (2025), iScience 28:113328, authors’ CC BY 4.0 deposit, averaged over the 233 published grid cells covering Britain