How deep is your source? Geothermal wells vs the heat-pump peak
heating
heat-pumps
geothermal
hydrogen
storage
adequacy
GB
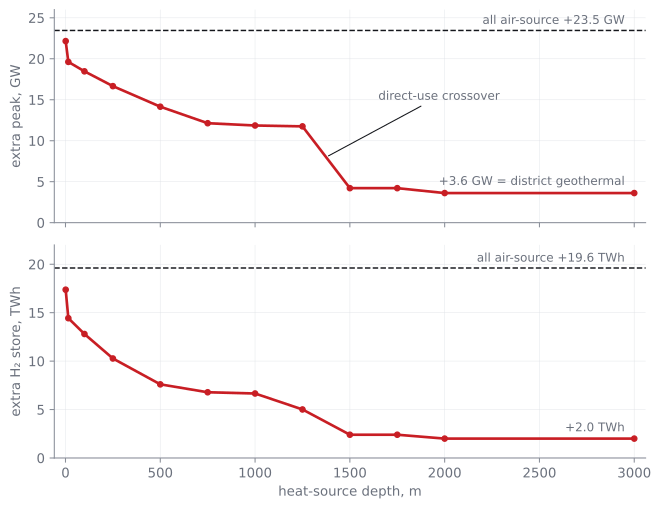
Electrify all of Britain’s heating with air-source heat pumps and the grid needs 23 GW more peak generation and 20 TWh more hydrogen store. Sweep the heat source deeper — a warmer well at every step — and by 2 km both penalties have collapsed by ~85%. Depth is a substitute for generation and storage.
INVESTIGATION · GB-TIER REPRODUCTION
A heat pump is a device for moving heat from a cold place to a warm one, and its appetite for electricity depends on how far apart those temperatures are. An air-source unit fights hardest exactly when the grid can least afford it — the coldest winter hour. A ground loop a metre down does a little better. But the ground gets warmer as you go down — about 25 °C per kilometre in the UK — and at around two kilometres the water is warm enough to heat a radiator directly, no heat pump at all. Air-source, ground-source, and deep geothermal aren’t three technologies. They’re one technology with a depth dial.
This investigation, prompted by a challenge from a correspondent in the geothermal industry, turns that dial and watches what happens to the two numbers a fully-electrified-heating Britain cares about: the peak the generating fleet must meet, and the hydrogen store it needs to survive forty years of real weather.
Research question
Take the wind + solar + hydrogen-store grid from the store-sizing investigation — the Royal-Society-style experiment, run over all 40 weather years (1985–2024). Electrify half of Britain’s heat demand and serve it with a single heat-pump technology. Then sweep the source depth from a 1 m shallow loop to a 3,000 m deep well and ask:
- How much of the heat-pump peak-demand penalty does depth remove?
- How much smaller is the 40-year hydrogen store the grid must build?
- What seasonal COP (delivered heat per unit of electricity) does each depth deliver?
Method
The heating overlay adds 410.5 TWh/yr of delivered heat (half of it electrified, 17% domestic hot water) to the RS-37y fleet, as single-technology portfolios: all air-source, all ground-source at each depth, all district geothermal. The ground source warms with depth via the UK geothermal gradient — centre 25 °C/km (deliberately conservative), BGS band 26–35 °C/km stated — and when the source arrives warmer than the sink, the heat pump hands off continuously to direct use. COP curves are field-trial calibrated (RHPP): these are as-delivered efficiencies, not nameplate.
For each portfolio the engine measures the peak residual demand and the smallest hydrogen store that never sheds load across 1985–2024. Every number below is a pinned regression value in the engine’s acceptance suite.
Result
Baseline (no heating electrification): peak 92.2 GW, store 23,872 GWh.
| Portfolio | Peak penalty | Hydrogen store penalty | Seasonal COP |
|---|---|---|---|
| All air-source | +23.5 GW | +19,616 GWh | 2.65 |
| Ground loop, 1 m | +22.2 GW | +17,376 GWh | 2.81 |
| 100 m | +18.5 GW | +12,800 GWh | 3.15 |
| 500 m | +14.1 GW | +7,600 GWh | 4.02 |
| 1,000 m | +11.9 GW | +6,656 GWh | 5.02 |
| 1,500 m | +4.2 GW | +2,400 GWh | 10.67 |
| 2,000 m (direct use) | +3.6 GW | +2,000 GWh | 15.0 |
| District geothermal | +3.6 GW | +2,000 GWh | 15.0 |
Three things the curve says.
Depth without warmth is nearly worthless. Going from 1 m to 15 m kills the seasonal temperature swing — the only thing a shallow ground loop buys — and recovers just 2.5 GW of the 22.2 GW penalty. This is why ground-source heat pumps, as installed today, barely dent the problem air-source creates.
The gradient does the work. By 500 m — a modest sedimentary-basin aquifer, not exotic drilling — the peak penalty is down 36% and the store penalty down 56% versus the shallow loop. By 1,250 m, before any direct use at all, roughly half the peak penalty and 71% of the store penalty are gone.
At the bottom of the well, the heat pump disappears. Between 1,250 m and 1,500 m the coldest winter hours cross into direct use and the peak penalty collapses from +11.8 GW to +4.2 GW. By 2,000 m the source arrives at ~60 °C — warmer than every radiator and hot-water sink in the model — and the all-well portfolio is district geothermal, exactly: same peak, same store, same COP of 15.
The replacement headline
Swap an all-air-source heat-pump fleet for 2,000 m geothermal and the grid avoids 19.8 GW of peak generation and 17.6 TWh of hydrogen store. Swap today’s shallow-loop ground-source instead, and it avoids 18.5 GW and 15.4 TWh. For scale: 17.6 TWh of avoided store is nearly three-quarters the size of the 23.9 TWh store the whole unheated system needs to survive December 1989.
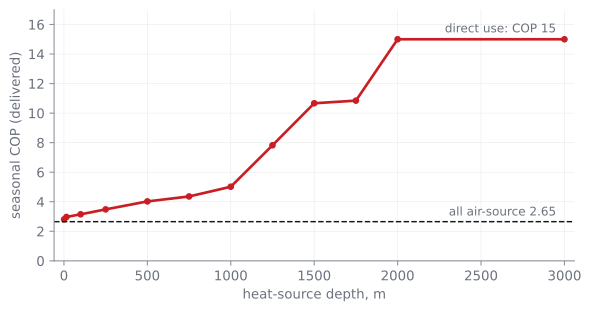
The model is honest at both ends. The all-air-source seasonal COP comes out at 2.65 — the RHPP field-trial median for air-source, the calibration anchor. Unprompted, the shallow ground-source figure lands on 2.81 — the RHPP ground-source field median. And at depth the COP saturates at the district pass-through of 15 rather than running away to infinity: the endpoints meet.
Reproduce it
Every number is a pinned regression value — the strongest reproduction path there is:
cargo test -p grid-adequacy --release --test geothermal_depth \
  continuum_curve_peak_and_storage_vs_depth_pinned
cargo test -p grid-adequacy --release --test geothermal_depth scop_vs_depth_pinned
Both print the full table and assert every value at 1e-9.
Discussion — what this does and doesn’t say
- Physical only — no £. Deeper wells cost more to drill, and drilling cost rises steeply with depth. This curve prices nothing; it only says what a warmer source buys in avoided generation and storage. The cost comparison is the essential follow-up.
- No cooling credit. A deep well can also sink summer heat — cooling demand the model doesn’t count. The benefit here is a lower bound.
- An idealised steady source. No thermal drawdown, no resource depletion — this flatters deep geothermal slightly.
- The gradient centre is conservative. 25 °C/km sits below the BGS band of 26–35 °C/km, so depth is under-credited; on the BGS band the direct-use crossover arrives shallower. A specific project’s gradient is a scenario input, not a national constant.
- The step is a model step. The collapse between 1,250 m and 1,500 m is where the binding winter hours flip to direct use under a deliberately frozen field-calibrated COP curve — its location is assumption-sensitive; its existence is not.
- Single-technology portfolios. All-air-source and all-2-km-wells are endpoints that bracket the question, not deployment forecasts.
Conclusion
Heat-pump heating’s burden on the grid is not fixed — it is a function of source temperature, which is a function of depth. The engine, swept along that dial, says the burden falls slowly to 1,250 m, collapses through the direct-use crossover, and lands at one-sixth of the air-source peak penalty and one-tenth of its storage penalty by 2 km. Whether the well is worth drilling is a cost question this investigation deliberately leaves open — but the thing the well buys is now a pinned, reproducible number.
Grid configuration
The grid behind the sweep (grid-cli describe)
Scenario: royal-society-37y  —  wind + solar + hydrogen storage only
Weather: 1985–2024, all 40 years on record (701,280 half-hourly periods), autarkic
Generation (3 technologies, 520.0 GW): offshore_wind 240, onshore_wind 80, solar 200 GW
Storage: hydrogen, energy requirement solved to zero-unserved
  (store power at the 200 GW convention — 100 GW is power-bound infeasible
  under all-electrified heating; peak residual is power-independent)
Heating overlay: 410.5 TWh/yr delivered heat, electrified share 0.5, DHW 0.170,
  single-technology portfolios (ASHP / GSHP at swept resource_depth_m / district),
  geothermal gradient centre 25 °C/km (BGS band 26–35 stated)
Dispatch policy: rule_based
Provenance
- Engine
-
grid-sim
dd17323· github.com/grid-modeller/grid-sim - Scenario
-
scenarios/royal-society-37y.toml+ the committed reference heating block - Pinned tests
-
geothermal_depth.rs(continuum_curve_peak_and_storage_vs_depth_pinned,scop_vs_depth_pinned) - Investigation
-
investigations/geothermal-depth-continuum/ - Data pack
- GB 40-year pack · Zenodo DOI: pending Phase-0 record
Generated using Copernicus Climate Change Service information (ERA5 weather). Geothermal gradient band: BGS (Busby 2014; Busby & Terrington 2017). Heat-pump performance calibration: RHPP field trial; Ruhnau/When2Heat COP curves.